
Pre-Pandemic, Pandemic, and Post-Pandemic Heat Changes In Houston
By
Daniel Ewetuya & Megan Tucker
Methodology
The MODIS and ASTER steps work independently from each other. Both were considered because of the difference in spatial resolution for better validation of the features. However, problems were experienced getting usable imagery with ASTER so the focus was with MODIS March, and April for the three years instead. The ASTER data would need to be have pixels averaged around random errors and around line stripped errors; which would bias results since we are interested in exact temperatures for the whole location. There were also unavailable data to mosaic the location by dates to compensate for the missing data. The steps are still similar for MODIS or ASTER so the workflow remains standard regardless of problems experienced with one type of dataset. The geometry tool should be used to stack the temperature images during the roi step to create the rois with minimal column and line differences that will be used in the change detection band math step. There should only be a difference of 1 in either the column or line for the image to remain consistent without major distortions during the subset creation.The band math for the change detection is float (b1) - float (b2) with the earlier year being b1 and the later year being b2; An image example of how the MODIS dataset was overlayed (Fig.3) is displayed below the workflow (Fig.2). Fig.4 Shows one of the ways NDVI and the spectral profile were used in the classification step.

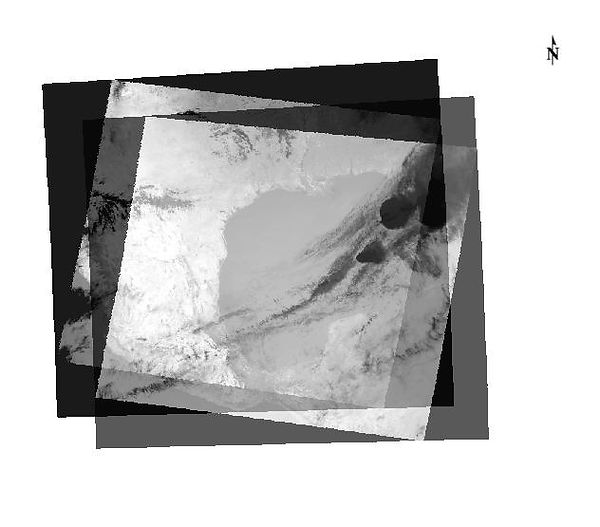
Fig.2 Workflow of Project
Fig.3 Overlaped Image demonstration for ROI construction with MODIS

Fig.4 NDVI on spectral profile used in feature identification for classfication